Quantcast
Channel:  RPi-Experiences
Viewing all 30 articles
Browse latest View live

RPi-Monitor: Version 1.4 is available

$
0
0
Note: A new version of RPi-Monitor is available: Version 1.5.
All the details about the latest version of Rpi-Monitor are in RPi-Monitor overview


The version 1.4 of RPi-Monitor has been released.

If you don't know yet what RPI-Monitor do, have a look to RPi-Monitor Overview

Package update status with detail.

What's new in this version?
  • Fix bugs 
  • Add package to be upgraded popover listing
  • Add firmware version
  • Increase shared memory to 8kb to support bigger json due to package upgrade status list
  • Add warning before closing or refreshing sheelinabox page to avoid unwanted connection closing
  • Remove graph without real meaning (voltage, cpu_frequency)
  • Remember last graph displayed (to make update easier just by clicking Statistics menu)
Installation
Download it from the official repository in Github:
    sudo wget http://goo.gl/MQg0v -O rpimonitor_1.4-1_all.deb

Install the dependencies by executing the following command:
    sudo apt-get install librrds-perl libhttp-daemon-perl

Installation or upgrade can be done with the command:
    sudo dpkg -i rpimonitor_1.4-1_all.deb

Usage
Browse your http://RPiIpAddress:8888/.

    RPi-Monitor: Build a multi-sites SSL certificate to improve user experience

    $
    0
    0
    This post comes in addition to my previous post: RPi-Monitor: Security and authentication with a reverse proxy.
    You may notice that your browser do not trust the certificate we generate consider it as insecure. In this post we will see how to create our own certificate and certificate authority. We will also see own to configure our browser to trust our certificate authority and consider the associated certificates as secure.


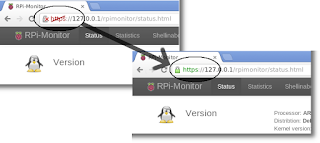
    Thanks to this actions, we will then move from https :-( to https :-) and remove the security warning.


    Note: Certificate generation has been extracted from a very interesting doc found in http://zepala.free.fr/?q=book/export/html/49.

    Create a multi-sites certificate
    To create the certificates we will need to execute numerous commands. These commands have been gathered into scripts that can be download from RPi-Monitor repository on Github

    Downloads make_ca.sh, make_cert.sh, openssl.cnf from Github directly on you RPi:

        wget http://goo.gl/amRwq -O make_ca.sh
        chmod +x make_ca.sh
        wget http://goo.gl/ERmln -O make_cert.sh
        chmod +x make_cert.sh
        wget http://goo.gl/PCSkE -O openssl.cnf

    Customize openssl.cnf and update the fields related to identity and network.

    Execute make_ca.sh and answer to the questions to create the CA ROOT

    Execute the following command and choose server then answer to the questions to create the certificate.

        make_cert.sh RPi-Experiences

    Install the certificate on server
    Copy certificates for nginx and shellinabox:

        sudo cp sslcert/private/RPi-Experiences-key.pem \
        sslcert/public/RPi-Experiences-cert.pem \
        /etc/ssl/localcerts/
        sudo sh -c "cat sslcert/private/RPi-Experiences-key.pem \
        sslcert/public/RPi-Experiences-cert.pem > \
        /var/lib/shellinabox/certificate.pem"

    Copy the cacert.pem and certificate.p12 into RPi-Monitor web root:

        sudo cp sslcert/public/cacert.pem \
        /usr/share/rpimonitor/web/
        sudo cp sslcert/public/RPi-Experiences-bundle.p12 \
        /usr/share/rpimonitor/web/certificate.p12

    Restart nginx and shellinabox

        sudo service nginx restart
        sudo service shellinabox restart

    Install CA ROOT and certificate with Google Chrome under Linux*
    * Note: I tried to install certificate on Windows but I didn't success. As I don't use Windows as my day to day OS, I stopped my investigation. I'm sorry for the 80% of people not using Linux... It is maybe time to jump into the open world! :-). If you succeed to install this certificate on Windows or other operating system your comments are welcome. A good starting point for such a thing would be to read CA Cert documentation.

    The first step will consist to download certificate and CA ROOT. This can be done from your server at the following addresses:
        https://RPiIpAddress/rpimonitor/cacert.pem

        https://RPiIpAddress/rpimonitor/certificate.p12

    The content of cacert.pem will be displayed in screen, save is as a file named cacert.pem

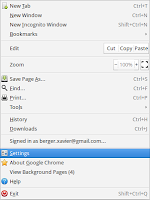
    Now, open Google Chrome and select settings:

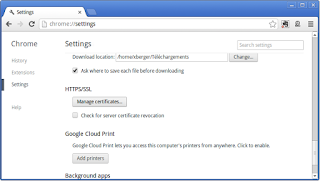
    At the bottom of the settings page, click on Show advanced settings...:

    Click on the button Manage certificates...:


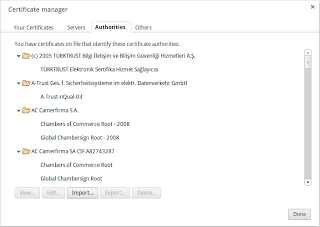
    Select the tab Authorities and click on Import...:

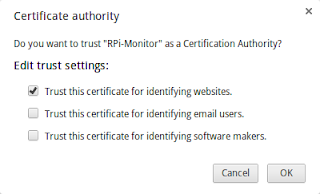
    Select the file cacert.pem previously downloaded and import it. The following message box will appear.
    Check Trust this certificate for identify website and click OK.
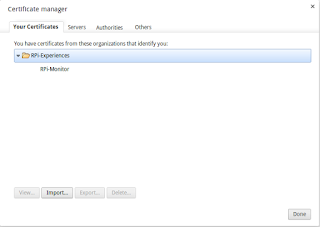
    The Certificate Authority is now installed. We will now install the certificate which will authenticate our web site. Select the tab Trust Certificates and click on Import...
    Import the file certificate.pk12 previously downloaded. 

    Note: In this screenshot, the certificate has already been imported
    Now the certificate the the CA ROOT are imported. Restart Google Chrome and connect to RPi-Monitor. You should have the security warning and the https lock icon should be green.


    RPi-Monitor: Version 1.5 is available

    $
    0
    0
    Note: A new version of RPi-Monitor is available: Version 2.0.
    All the details about the latest version of Rpi-Monitor are in RPi-Monitor overview

    The version 1.5 of RPi-Monitor has been released.

    If you don't know yet what RPI-Monitor do, have a look to RPi-Monitor Overview. This version come with bug fixes to allow the usage of RPi-Monitor with an external web server.

    Photo from Flickr AttributionNoncommercialNo Derivative Works cc-by-nc-nd by P_Breen
    What's new in this version?
    • Fix bugs highligthed by validator.w3.org
    • Fix bugs avoiding RPi-Monitor to work properly with an external web server

    Installation
    Download it from the official repository in Github:
        sudo wget http://goo.gl/1nLpA -O rpimonitor_1.5-1_all.deb

    Install the dependencies by executing the following command:
        sudo apt-get install librrds-perl libhttp-daemon-perl

    Installation or upgrade can be done with the command:
        sudo dpkg -i rpimonitor_1.5-1_all.deb

    Usage
    Browse your http://RPiIpAddress:8888/.

    RPi-Monitor: Advance usage and customization

    $
    0
    0
    Note: A new version of RPi-Monitor is available: Version 2.0.
    All the details about the latest version of Rpi-Monitor are in RPi-Monitor overview

    RPi-Monitor is designed to be flexible and configurable. But how should I do if I want to:
    • Customize RPi-Monitor to fit a particular needs?
    • Use it with my own Web Server? 
    • Add "friends" linking RPi-Monitor running on different platform together?
    • Use it into another Linux distribution than Raspbian? 
    • Add other graphs from additional sources (other mount point or external temperature probe)?
    • Customize graph to display bandwidth (from an idea from tduval shared in Github issue)

    Photo from Flickr AttributionNoncommercialNo Derivative Works cc-by-nc-nd by WingedWolf
    All these questions will be answered into this post and as a bonus, we will also see how to install a little electronic DS18B20 temperature probe.

    Customize RPi-Monitor to fit a particular needs

    If you want to customize RPi-Monitor in a way not described bellow you just have to know 2 things:
    • The man page is explaining how to use rpimonitord.
    • The configuration file is documented to let you customize to your need.
    You will find bellow some example of customization.

    Warning: Be sure to use Linux filefeed format with line ending with LF (and not CR/LF like in Windows).


    Use it with my own Web Server

    In this example I will use nginx server. You could use the same tactic with your preferred web server.

    Let's first update the configuration file to disable the embedded web server. Edit the file /etc/rpimonitord.conf and set noserver=1.

    Then restart RPi-Monitor with the command:
        sudo service rpimonitor restart

    The embedded server is no more running so, we will need to configure another server to access the data.

    For nginx we will create the file /etc/nginx/sites-enabled/rpimonitor with the following content:
        server {
            listen  80;
            index   index.html;
            root    /usr/share/rpimonitor/web;
        }

    and restart the server with the command:
        sudo service nginx restart
    Now you can reach RPi-Monitor with your favorite browser on your favorite web server.


    Add "friends" linking RPi-Monitor running on different platform together

    Friends is a notion that comes in version 1.2. A friend is simply another computer running RPi-Monitor. Configuring friends will add a drop down list on the right of the top menu with a links to RPi-Monitor sitting on the other computer.

    Friends menu is visible on the top right

    In /etc/rpimonitord.conf, Comment starting by #> are specific comments. These comments  will be processed by rpimonitord and integrated into the json sent to the server in the form of an array having the name specified into the section. The data are not processed by rpimonitord. The server will parse and use them.

    Here is an example of configuration for 3 friends:
        #>[friends]
        #>"192.168.0.123:8888=Raspberry Pi"
        #>"192.168.0.2:8888=Shuttle"
        #>"127.0.0.1:8888=Laptop"


    Use it into another Linux distribution than Raspbian

    RPi-Monitor has been designed to run into a Raspberry Pi but as it is using only standard Linux resources, it is not hardware dependent. A simple configuration update can make it run on Ubuntu, CentOS or any other distribution.

    Ubuntu is a Debian based distribution as Raspbian. The installation can then be done using the deb package available for each releases. Download and install the package as described in this previous post.

    With CentOS and withe any non Debian based distribution it will required to perform a manual installation.
    After installing the perl dependencies: HTTP::Daemon (perl-libwww-perl) and RRD (rrdtool-perl), download the archive from github using the following command:
        wget http://goo.gl/5vbYu -O Version-1.5.zip

    Then unpack it.
        unzip Version-1.5.zip

    Finally install rpimonitor manually:
        su -
        mv RPi-Monitor-Version-1.5/rpimonitor /usr/local

    You can now start RPi-Monitor with the following commands:
        cd /usr/local/rpimonitor
        ./rpimonitird

    Note: I will not describe here how to configure the auto startup since each distribution has its own way to do so. An upstart script is available into RPi-Monitorgithub tools directory, it may help you in such an action.

    Once the installation is done you can start RPi-Monitor and connect to it with your favorite browser.
    You may notice that some values are not presents or displayed as NaN (Not a Number). To fix these issues, you will have to update the configuration file (/etc/rpimonitord.conf or /usr/local/rpimonitor/rpimonitor.conf).
    The current version is not fully customization through the configuration file. It could then be required for experts to dive into the code to customize the pages. Javascripts doing the rendering are available in the sub directory js. Improvement are planned for version 2.0.

    RPi-Monitor running on Ubuntu (before custimization)


    Add other graphs from additional sources: other mount point

    Lets start with something simple and see how to add graphs for additional mount point.

    To add a graph to RPi-Monitor statistic, we need to create a new section. Let's call it [ExternalHDD].
    Then we have to declare the new data names HDD_Free, we will get that with the command df associated with the correct regular expression. To defined the exact command, it is advised to test the command before adding it into the configuration file. This can be done easily like this:

        COMMAND | perl -ne '/REGEXP/' and print "$1\n"'

    Where COMMAND will give the source of information to process and REGEXP will extract the information for RPi-Monitor. Let get an example with the command df:

    pi@raspberrypi~ $ df -t ext3
    Filesystem           1K-blocks      Used Available Use% Mounted on
    /dev/sdb1            140340132    192128 133019124   1% /media/storage

    pi@raspberrypi ~ $ df -t ext3| perl -ne '/sdb1(?:\s+\d+){2}\s+(\d+)/ and print "$1\n"'
    133019124

    The command to execute is df -t ext3 and the regular expression to apply is  sdb1(?:\s+\d+){2}\s+(\d+). Note: I'll note explain regular expression here, there are many site on the Internet about this subject.
    The configuration line will then be:
        HDD_FREE=df -t ext3=sdb1(?:\s+\d+){2}\s+(\d+)

    To have a new graph into statistic we will add the following configuration at the end to /etc/rpimonitord.conf:
        [ExternalHDD]
        HDD_FREE=df -t ext3=sdb1(?:\s+\d+){2}\s+(\d+)

    To complete the installation we have to restart RPi-Monitor and refresh the statistics page into our browser.
        sudo  service rpimonitor restart

    Graph of External HDD


    Add other graphs from additional sources: external temperature probe

    Let's build a little electronic device to measure the room temperature and add this in the temperature graph.
    Do do that, you will need:
    • 1 x DS18B20
    • 1 x 4.7k resistor
    Plug them as described in the following schema extracted from Adafruit Lesson 11:


    Lets first load the kernel module required to get the information from this probe:
        sudo modprobe gpio
        sudo modprobe w1-gpio
        sudo modprobe w1-therm

    First we have to identify the id of our probe:
        ls /sys/bus/w1/devices/
        28-000004fe1847  w1_bus_master1

    the id is: 28-000004fe1847. Let's now check if we can get the temperature:
        cat /sys/bus/w1/devices/28-000004fe1847/w1_slave
        5a 01 4b 46 7f ff 06 10 a3 : crc=a3 YES
        5a 01 4b 46 7f ff 06 10 a3 t=21625

    It looks to work. So now we need to extract the the numbers ending the second line (21625). The regular expression will then be t.(\d+)$. I'll not do a course about what a regexp is there are many site on the internet explaining it.
    Note: In version 1.x of RPi-Monitor it is prohibited to use = in regular expression.

    To add a graph to RPi-Monitor statistic, we need to create a new section. Let's call it [room_temperature]. Then we have to declare the new data name room_temp, its source /sys/bus/w1/devices/28-000004fe1847/w1_slave and the associated regular expression t.(\d+)$. The line to append will look like that:
        # Room temperature
        [room_temperature]
        room_temp=/sys/bus/w1/devices/28-000004fe1847/w1_slave=t.(\d+)$

    Restart RPi-Monitor with the following command and it is done:
        sudo  service rpimonitor restart

    A new graph is available in statistics (wait a little bit to have data and drawing):

    Use zoom feature to see the freshly added data.
    If you want to add a curve into the Temperature graph, it is possible by adding the KPI line into the section [temperature] as describe bellow:
        [temperature]
        soc_temp=/sys/devices/virtual/thermal/thermal_zone0/temp=(.*)
        home_temp=/sys/bus/w1/devices/28-000004fe1847/w1_slave=t.(\d+)$

    It will then be required to delete the associated rrd file:
        sudo rm /usr/share/rpimonitor/web/stat/temperature.rrd

    Restarting RPi-Monitor will regenerate this file with the two describes temperature. After waiting some time to let data to be added, you will have a graph with two temperatures as in the screenshot bellow:

    soc_temp and home_temp drawn on the same graph


    Customize graph to display bandwidth

    Some users (only one for the moment) have already share customization made like tduval who wrote the following in Github issue.

        I made a custom script to add Network Traffic Statistics.
        Here is the script shell : http://pastebin.com/XPnQN0J5
        and in the /etc/rpimonitord.conf, I add this at the end of the file:
        # Network Traffic
        [networktraffic]
        net_in=sh /usr/share/rpimonitor/web/custom/netTraffic.sh=rx.(.*)
        net_out=sh /usr/share/rpimonitor/web/custom/netTraffic.sh=tx.(.*)
       After a service rpimonitor restart, I've got this: http://hpics.li/de06f90
    Bandwidth generated with the script netTraffic.sh
    Thanks to him for sharing this customization.

    RPi-Monitor: Version 2.0 is available

    $
    0
    0
    Note: A new version of RPi-Monitor is available: Version 2.1.
    All the details about the latest version of Rpi-Monitor are in RPi-Monitor overview

    The version 2.0 of RPi-Monitor has been released.

    If you don't know yet what RPI-Monitor do, have a look to RPi-Monitor Overview.

    Photo from Flickr  AttributionShare Alike cc-by-sa by bovinity

    What's new in this version?

    A lot of changes have been done in the code of RPi-Monitor. Most of these changes are invisible from a first look except maybe a better look'n feel...
    RPi-Monitor is now fully configurable. Everything displays in status page or in statistics page can be modified, tuned and customized to your needs. You can see the manpages of rpimonitord and rpimonitord.conf for deepers details.

    Here is the changelog of version 2.0:
    •  Add the possibility to draw static values
    •  Remove update package status update after apt-get command. Update command will have to be executed manually.
    •  Add redirection for shellinabox for url /shellinabox
    •  Add a manpage dedicated to configuration: man rpimonitord.conf
    •  Change in configuration files to make status and statistic pages fully configurable
    •  Add post-process formula to have more readable values
    •  Curves displayed in graph are now fully configurable
    •  Remove Legend position and timezone from graphs
    •  Make legend of graph configurable


      Installation

      Download it from the official repository in Github:
          sudo wget http://goo.gl/CkP3U -O rpimonitor_2.0-1_all.deb

      Install the dependencies by executing the following command:
          sudo apt-get install librrds-perl libhttp-daemon-perl libjson-perl

      Installation or upgrade can be done with the command:
          sudo dpkg -i rpimonitor_2.0-1_all.deb

      Important notices
      • RPi-Monitor 2.0 depends on libjson-perl which need to be install in addition to RPI-Monitor 1.x dependencies
      • Configuration file and RRD of RPI-Monitor version 2.0 are not compatible with version 1.x. If you previously used version 1.x, it is advised to remove RPi-Monitor before installing this version.


      Customization

      RPi-Monitor is now fully configurable so if the displayed information doesn't match you need, customize it.
      Everything display in status page or in statistics page can be modified, tuned and customized to your needs.

      To see how to customize it, use the command
          man rpimonitord
      and
          man rpimonitord.conf

      Man pages are also available in the wiki.

      You will find some examples of customisation in RPi-Monitor articles.

      Usage

      Once RPi-Monitor is configured as you wished, browse http://RPiIpAddress:8888/ to access to the web interface.

      Note: The graphs rendering may have strange behavior on Google-Chrome on Windows while it works fine on Linux. Internet Explorer is even not able to display statistics, it is then advised to use Firefox on Windows or better... switch to Linux! ;-). 

      RPi-Monitor: Version 2.x advance usage and customization

      $
      0
      0
      Edit: RPi-Monitor version 2.7 introduce a change in configuration name and location:
      • /etc/rpimonitor d.conf becomes /etc/rpimonitor/daemon.conf
      • /etc/rpimonitord.conf.d becomes /etc/rpimonitor/data.conf
      • /etc/rpimonitord.conf.d/*.conf becomes /etc/rpimonitor/*.conf

      In this article we will see how to do the things described in RPi-Monitor: Advance usage and customization and maybe, a little bit more...

      We will then answer the same questions : How should I do if I want to...
      • Customize RPi-Monitor v2.x to fit a particular needs?
      • Use it with my own Web Server? 
      • Add "friends" linking RPi-Monitor v2.x running on different platform together?
      • Use it into another Linux distribution than Raspbian? 
      • Add other graphs from additional sources (other mount point or external temperature probe)?

      Photo from Flickr AttributionNoncommercialShare Alike cc-by-nc-sa by blogjunkie
      Note: A prerequisite is to install the latest version of RPi-Monitor v2.x
      Customize RPi-Monitor v2.x to fit a particular needs

      If you want to customize RPi-Monitor in a way not described bellow you just have to know 2 things:
      • The man pages rpimonitord and rpimonitord.conf explains how to use and configure RPi-Monitor.
      • The configuration file is documented to let you customize to your need.
      You will find bellow some example of customization showing you the capababilities of RPi-Monitor v2.x


      Use it with my own Web Server

      In this example I will use nginx server. You could use the same tactic with your preferred web server.

      Let's first update the configuration file to disable the embedded web server. Edit the file /etc/rpimonitord.conf and set daemon.noserver=1.

      Then restart RPi-Monitor with the command:
          sudo service rpimonitor restart

      The embedded server is no more running so, we will need to configure another server to access the data.

      For nginx we will create the file /etc/nginx/sites-enabled/rpimonitor with the following content:


      and restart the server with the command:
          sudo service nginx restart

      Now you can reach RPi-Monitor with your favorite browser on your favorite web server.

      To go further, you can read the article RPi-Monitor: Build a multi-sites SSL certificate to improve user experience.


      Add "friends" linking RPi-Monitor running on different platform together

      Friends is a notion that comes in version 1.2. A friend is simply another computer running RPi-Monitor. Configuring friends will add a drop down list on the right of the top menu with a links to RPi-Monitor sitting on the other computer.

      Friends menu is visible on the top right

      In /etc/rpimonitord.conf.d/default.conf, each friend is identified by its and is described by the 2 following parameters:

      Here is an example of configuration for 3 friends:


      Use it into another Linux distribution than Raspbian

      RPi-Monitor has been designed to run into a Raspberry Pi but as it is using only standard Linux resources, it is not hardware dependent. A simple configuration update can make it run on UbuntuCentOS or any other distribution.

      Ubuntu is a Debian based distribution as Raspbian. The installation can then be done using the deb package available for each releases. Download and install the package as described in this previous post.

      With CentOS and withe any non Debian based distribution it will required to perform a manual installation.
      First install the perl dependencies: HTTP::Daemon (perl-libwww-perl), RRD (rrdtool-perl) and JSON(perl-JSON)

      Connect to github and select the latest stable branch on the top left dropdown list.
      Then download the code as zip file from the link "Download zip" visible at the bottom of the right menu.

      Unpack it.
          unzip Version-2.x.zip

      Finally install rpimonitor manually:
          su -
          mv Version-2.x/rpimonitor /usr/local

      You can now start RPi-Monitor with the following commands:
          cd /usr/local/rpimonitor
          ./rpimonitird -c rpimonitor.conf -c default.conf

      Note: I will not describe here how to configure the auto startup since each distribution has its own way to do so. An upstart script is available into RPi-Monitor github tools directory, it may help you in such an action.


      Once the installation is done you can start RPi-Monitor and connect to it with your favorite browser.
      You may notice that some values are undefined or displayed as NaN (Not a Number). To fix these issues, you will have to update the configuration file (rpimonitord.conf or default.conf in /etc/ + /etc/rpimonitord.conf.d or /usr/local/rpimonitor/ depending on your installation).

      CentOS 6.3 before configuration file customisation


      Add other graphs from additional sources: other mount point

      For this section we will take the example of an additional disk on sda as described previous article  RPi-Monitor: Advance usage and customization.

      The disk have a disk with two partition /dev/sda1 and /dev/sda3.
      The command and regular expression will be the following:
      • sda1 disk size command : df -t ext2,  regular expression: sda1\s+(\d+)
      • sda1 used space command : df -t ext2,  regular expression: sda1\s+\d+\s+(\d+)
      • sda3 disk size command : df -t ext4,  regular expression: sda3\s+(\d+)
      • sda3 used space command : df -t ext4,  regular expression: sda3\s+\d+\s+(\d+)
      First we need to configure the extraction of partitions sizes which are extracted once at RPi-Monitor startup. We will create a file /etc/rpimonitord.conf.d/custo.conf with the data configured as static data like this:

      The id of the KPIs start at 10 since in my configuration files the previous KPI was 9. This comment is the same for next ids.
      The post processing is configured to transform kB into MB by dividing the extracted result by 1024.

      For dynamic values extracted every 10 seconds, the configuration will be:


      Dynamic stat will be stored into a RRD File as GAUGE. Ref to RRDTool help for detail about Data Source Types.
      Now we will add a status line for this disk whit the following icon:

      Disk icon has been found here
      This icons has to be installed into the img directory of RPi-Monitor which is by default /usr/share/rpimonitor/web/img/.

      The configuration to add a new status strip will then be the following:
          

      The configuration may need some explanation:
      We do configure 4 lines. Each line is describing a javascript line using some predefined functions: KMG, Precent and ProgressBar. This function are called by the browser while rendering the page. Some variable coming from the extracted data are also used. These variables are starting by the keyword 'data.'. For deeper detail about this configuration execute the command man rpimonitord.conf

      To see our modification we need to restart RPi-Monitor and refresh the statistics page into our browser.
          sudo  service rpimonitor restart

      The result of the configuration is at the bottom of the following screenshot:


      The status page is working, let's now add a graphic of the disk usage. This is done with the following configuration:

      The configuration may also need some explanation
      We do configure 2 graphs each having 2 curves. The first curve represent the total and is using static data extracted previously. This curve will be represented as a light red line.
      The second curve is representing the usage of disk and is represented as a light blue line filled. The parameters defining the curve are define by the keyword ds_graph_options. Details of this parameter can be found in javascriptrrd help page. Restart rpimonitor to activate the new graph.

      After waiting a little time to let the system extract data you will see this kind of graph.


      Add other graphs from additional sources: external temperature probe

      Let's build a little electronic device to measure the room temperature and add this in the temperature graph.
      Do do that, you will need:
      • 1 x DS18B20
      • 1 x 4.7k resistor
      Plug them as described in the following schema extracted from Adafruit Lesson 11:


      Lets first load the kernel module required to get the information from this probe:
          sudo modprobe gpio
          sudo modprobe w1-gpio
          sudo modprobe w1-therm

      First we have to identify the id of our probe:
          ls /sys/bus/w1/devices/
          28-000004fe1847  w1_bus_master1

      the id is: 28-000004fe1847. Let's now check if we can get the temperature:
          cat /sys/bus/w1/devices/28-000004fe1847/w1_slave
          5a 01 4b 46 7f ff 06 10 a3 : crc=a3 YES
          5a 01 4b 46 7f ff 06 10 a3 t=21625

      It looks to work. So now we need to extract the the numbers ending the second line (21625). The regular expression will then be t=(\d+)$. I'll not do a course about what a regexp is there are many site on the internet explaining it.

      The following configuration have to be added at the end of /etc/rpi-monitord.conf.d/custo.conf. It will extract the temperature measured by the external probe:

      We will then add the livingroom temperature as Ambient temperature into the existing Temperature status strip by adding the following line at the end of the file custo.conf:

      After restarting RPi-Monitor, you will see the Ambient temperature into the status page as in the screenshot bellow:


      We will then add the Ambiant temperature into the existing Temperature graph by adding the following line to custo.conf:

      After restarting RPi-Monitor, you will see the Ambient temperature as an additional curve into the Temperature graph of the statistics page as in the screenshot bellow:


      RPi-Monitor: Version 2.1 is available

      $
      0
      0
      Note: A new version of RPi-Monitor is available: Version 2.2.
      All the details about the latest version of Rpi-Monitor are in RPi-Monitor overview

      The version 2.1 of RPi-Monitor has been released.

      If you don't know yet what RPI-Monitor do, have a look to RPi-Monitor Overview.

      Photo from Flickr AttributionNoncommercialShare Alike cc-by-nc-sa bmatthileo

      What's new in this version?

      This version brings small improvement and extends the customisation capabilities.

      Here is the changelog of version 2.1:
      • Precheck result before adding in RRD to improve graphs
      • Add the possibility to customize axis with graph_options parameter
      • Add timeout for KPI reading to avoid possible hang when reading external sensors
      • Change keywork ds_graph_opts by ds_graph_options to be consistant with javascriptrrd and flot documentation. Keep that in mind if you did some customisation.
      • Fix Issue #6: a stranger rpimonitor.conf
      • .


        Installation

        Download it from the official repository in Github:
            sudo wget http://goo.gl/NLVKa -O rpimonitor_2.1-1_all.deb

        Install the dependencies by executing the following command:
            sudo apt-get install librrds-perl libhttp-daemon-perl libjson-perl

        Installation or upgrade can be done with the command:
            sudo dpkg -i rpimonitor_2.1-1_all.deb


        Customization

        RPi-Monitor is now fully configurable so if the displayed information doesn't match you need, customize it.
        Everything display in status page or in statistics page can be modified, tuned and customized to your needs.

        To see how to customize it, use the command
            man rpimonitord
        and
            man rpimonitord.conf

        Man pages are also available in the wiki.

        You will find some examples of customisation in RPi-Monitor articles.

        Usage

        Once RPi-Monitor is configured as you wished, browse http://RPiIpAddress:8888/ to access to the web interface.

        Note: The graphs rendering may have strange behavior on Google-Chrome on Windows while it works fine on Linux. Internet Explorer is even not able to display statistics, it is then advised to use Firefox on Windows or better... switch to Linux! ;-). 


        Future article

        RPi-Monitor has some hidden feature. We will see in a future article how to add a second axis to the graph to represent the humidity given by an external sensor (DHT11 or DHT22). Stay tuned ;-)

        RPi-Monitor: Use a DHT11 or DHT22 humidity and temperature sensor

        $
        0
        0
        In this post we will see how to connect a DHT11 or DHT22 Temperature and Humidity sensor and configure RPi-Monitor to present and draw the outputs.

        Photo from Flickr AttributionNoncommercialNo Derivative Works cc-by-nc-nd by Ham Hock
        This article will also explain another capability of RPi-Monitor 2.x: the dual-axis.


        Adafruit created a very good tutorial explaining how to use DHT11 or DHT22 . This tutorial is available at this address: http://learn.adafruit.com/dht-humidity-sensing-on-raspberry-pi-with-gdocs-logging/wiring.


        Electronic assembly
        This electronic assembly is quite simple and will need:
        • 1 x DHT11 or 1 x DHT22
        • 1 x 4.7k resistor
        Plug them as described in the following schema:

        Schema extracted from Adafruit but using GPIO #27 instead of GPIO #4

        Software installation
        Thanks to Adafruit ( again ;-) ) the installation is quite simple and can be done with two command lines.
        Download Adafruit_DHT form Adafruit's github repository and copy is in /usr/bin as follow:
        wget http://goo.gl/oadpl -O Adafruit_DHT
        sudo cp Adafruit_DHT /usr/bin/
        To test the electronic assembly and the software installation execute the following command (for DHT11):
        pi@raspberrypi~ $ sudo Adafruit_DHT 11 27
        Using pin #17Data (40): 0x28 0x0 0x18 0x0 0x40
        Temp = 24 *C, Hum = 40 %
        You should see the information about temperature and humidity displayed as shown upper.

        Note: The DHT11 and DHT22 sensors will only respond every second so if you are not getting data, be sure to wait few seconds before trying again.


        RPi-Monitor configuration

        Warning: Be sure to use Linux linefeed format with line ending with LF (and not CR/LF like in Windows).

        Let's now use this information and add humidity graphs on existing temperature graph.

        We first have to extract the data. This is done like this:

        For more information about this configuration, refer to the post:  RPi-Monitor: Version 2.0 advance usage and customization

        We will now add the humidity curve into the graph of temperature. This can be done with the configuration bellow:
        As the unit are different than the one existing on the initial axis, we will add a second axis for the percentage of humidity. This is the purpose of the two last lines of the configuration bellow.
        The first line is defining the usage of axis number 2 for the humidity.
        The last line is defining how this graph should be drawn: On the right, starting from 0 up to 100.

        graph_options can have other usefull option. They are described in the documentation of javascriptrrd.

        After restarting RPi-Monotor with the command:
        service rpimonitor restart
        You will see a new curve in Temperature graph as shown in the screenshot bellow:

        Graph with 2 Y axis: °C in left axis and % humidity (fixed from 0% to 100%) on right axis


        RPi-Monitor: Version 2.2 is available

        $
        0
        0
        Note: A new version of RPi-Monitor is available: Version 2.3.
        All the details about the latest version of Rpi-Monitor are in RPi-Monitor overview

        The version 2.2 of RPi-Monitor has been released.

        If you don't know yet what RPI-Monitor do, have a look to RPi-Monitor Overview.

        Photo from Flickr AttributionNoncommercialShare Alike cc-by-nc-sa by jacqueline-w


        What's new in this version?

        This version comes with bug fix, optimization and extends the customization capabilities by adding multiple pages for status and statistics.

        Here is the changelog of version 2.2:
        • Add the possibility to create multiple status and statistics pages
        • Add process respawner to improve reliability of rpimonitord
        • Add HTML5 cache for json data to speedup page display and offload RPi
        • bug fix: Embedded server won't start on 443 or 80 ports (issue #8)
        • bug fix: cleanup code according to comment described in issue #7 


          Installation

          Download it from the official repository in Github:
              sudo wget http://goo.gl/miZ79 -O rpimonitor_2.2-1_all.deb

          Install the dependencies by executing the following command:
              sudo apt-get install librrds-perl libhttp-daemon-perl libjson-perl

          Installation or upgrade can be done with the command:
              sudo dpkg -i rpimonitor_2.2-1_all.deb


          Customization

          RPi-Monitor is fully configurable so if the displayed information doesn't match you need, customize it.
          Everything display in status pages or in statistics pages can be modified, tuned and customized to your needs.

          To see how to customize it, use the command
              man rpimonitord
          and
              man rpimonitord.conf

          Man pages are also available in the wiki.

          You will find some examples of customisation in RPi-Monitor articles.

          About multiple pages

          This version of RPi-Monitor introduce the notion of pages. Adding a new page can be done in configuration file by setting the parameter named <page id>.
          RPi-Monitor will automatically interpret this new id and create the associated page. The new page will be accessible by a drop down menu as shown in the screenshot bellow.


          RPi-Monitor showing multiple status pages

          RPi-Monitor showing multiple graph pages

          The file custo.conf available in github shows how to configure additional pages from information gathered from external sensors. This is the configuration file used for the examples shows in upper screenshots.


          Usage

          Once RPi-Monitor is configured as you wished, browse http://RPiIpAddress:8888/ to access to the web interface.

          Note: The graphs rendering may have strange behavior on Google-Chrome on Windows while it works fine on Linux. Internet Explorer is even not able to display statistics, it is then advised to use Firefox on Windows or better... switch to Linux! ;-). 


          A LCD display my RPi and RPi-Monitor

          $
          0
          0
          I saw on the internet that it is possible to use a LCD to display information from the Raspberry Pi. RPi-Monitor is gathering a lot of information and it could be interesting to have such an information available without a computer. So I decided to purchase a PCD8544 from dx.com.

          Photo from Flickr Attribution cc-by by arduinolabs

          This post is describing how to acquire, connect and use such a component with he Raspberry Pi and gives an example showing how to connect it with RPi-Monitor.


          Step 1: The acquisition


          I found on the Internet a site reselling the PCD8544 for few euros (dx.com). After a moment of hesitation, I decided to give a try and I purchased it. It was the 16th of may.

          The 27th of may, I received a e-mail saying that my purchase was partially shipped, one element is no more available (I've been reimbursed) and a last element will be sent later...

          I finally received all my good 4 weeks after the initial purchase order. This site doesn't contradict its reputation: It delivers the good but you have to be patient... very patient ;-).

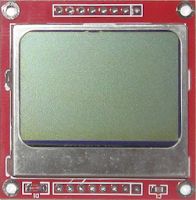
          PCD8544 LCD screen


          Step 2: The connection

          The PCD8544 comes in two parts (the lcd screen and the pins) that need to be soldered together. Once done, it can be installed in the breadboard as shown in the drawing bellow:

          Schema made with Fritzing (fritzing.org)
          Note: If you want to reproduce this assembly, check carefully the pin order, it may be different.


          Step 3: The preparation

          My first goal is to test this new display. I look on the internet and find different solution using Python or C. After few tries, I decided to use Python based on the information shared into this post.

          To use the PCD8544 display we need to install few software and load a kernel module.

          First, let's install wiringpi2 from drogon.net
          git clone git://git.drogon.net/wiringPi
          cd wiringPi
          ./build
          Once wiringpi is installed, it is possible to test it with the following command:
          gpio readall
           +-----+-------+------+----+-Rev2-----+----+------+-------+-----+
          | wPi | Name | Mode | Val| Physical |Val | Mode | Name | wPi |
          +-----+-------+------+----+----++----+----+------+-------+-----+
          | | 3.3v | | | 1 || 2 | | | 5v | |
          | 8 | SDA | IN | Lo | 3 || 4 | | | 5V | |
          | 9 | SCL | IN | Lo | 5 || 6 | | | 0v | |
          | 7 | GPIO7 | IN | Lo | 7 || 8 | Lo | ALT0 | TxD | 15 |
          | | 0v | | | 9 || 10 | Lo | ALT0 | RxD | 16 |
          | 0 | GPIO0 | IN | Hi | 11 || 12 | Hi | OUT | GPIO1 | 1 |
          | 2 | GPIO2 | IN | Lo | 13 || 14 | | | 0v | |
          | 3 | GPIO3 | IN | Hi | 15 || 16 | Lo | OUT | GPIO4 | 4 |
          | | 3.3v | | | 17 || 18 | Lo | OUT | GPIO5 | 5 |
          | 12 | MOSI | ALT0 | Hi | 19 || 20 | | | 0v | |
          | 13 | MISO | ALT0 | Hi | 21 || 22 | Hi | IN | GPIO6 | 6 |
          | 14 | SCLK | ALT0 | Hi | 23 || 24 | Lo | ALT0 | CE1 | 10 |
          | | 0v | | | 25 || 26 | Lo | ALT0 | CE1 | 11 |
          +-----+-------+------+----+----++----+----+------+-------+-----+
          Now, install the python binding of wiringpi:
          sudo apt-get install python-dev python-imaging python-imaging-tk python-pip
          sudo pip install wiringpi2
          The program we will use require spidev to be activated. The kernel module should then be activated.
          To do so, comment the line blacklist spi-bcm2708 by adding a heading # in the file /etc/modprobe.d/raspi-blacklist.conf then reboot the Raspberry Pi to activate this module.

          Finally install spidev python library:
          sudo pip install spidev
          The prerequisite are now installed. In next chapter we will see how to install the python library in charge of driving the PCD8544 LCD and how to use it.

          Step 4: The installation

          Into Raspberry Pi forum, an interesting post catch my attention. I used it as the base to control the LCD.
          The library written Richard Hull's is also interesting I then took this as a example to create module that can be directly installed on the Raspberry Pi.
          This pcd8544 library resulting is available into its own dedicated repository in github.
          To install it, execute the following commands:
          git clone https://github.com/XavierBerger/pcd8544.git
          cd pcd8544
          ./setup.py clean build 
          sudo ./setup.py install
           You can now test the installation with the proposed examples:
          cd examples
          ./pi_logo.py
           If installation works properly, you should see the following screen:

          You can try to execute other examples to see what the library is capable to do with this LCD.


          Step 5: The utilization

          As I said in introduction, RPi-Monitor is gathering a lot of information and some of them may be interesting to have without having to start a PC. Information are made available from the embedded web server. To get and display the information we then just have to create a web client and use the library to display.

          For people interesting about learning development I did comment my code:
          This code is dedicated to extract the living room temperature and humidity from RPi-Monitor information.
          Copy this code into a file (rpimonitor-testlcd.py) the make this file executable (chmod +x rpimonitor-testlcd.py) then execute (./rpimonitor-testlcd.py) it to see:


          RPi-Monitor: Version 2.3 is available

          $
          0
          0
          Note: A new version of RPi-Monitor is available: Version 2.4.
          All the details about the latest version of Rpi-Monitor are in RPi-Monitor overview

          The version 2.3 of RPi-Monitor has been released.

          If you don't know yet what RPI-Monitor do, have a look to RPi-Monitor Overview.

          Photo from Flickr AttributionNoncommercialShare Alike cc-by-nc-sa by reidab

          What's new in this version?

          This version mainly comes with bug fixes and few optimisation.

          Here is the changelog of version 2.3:
          • Add small improvement given by a feedback in RPi-Experiences blog
          • Use javascript to resize correctly shellinabox iframe even in Firefox
          • Fix issue #9: Wrong calculation of used memory
          • Fix issue #11: adding friends link missing colon
          •  

          Installation

          Download it from the official repository in Github:
              sudo wget http://goo.gl/lkfPJL -O rpimonitor_2.3-1_all.deb

          Install the dependencies by executing the following command:
              sudo apt-get install librrds-perl libhttp-daemon-perl libjson-perl

          Installation or upgrade can be done with the command:
              sudo dpkg -i rpimonitor_2.3-1_all.deb


          Customization

          RPi-Monitor is fully configurable so if the displayed information doesn't match you need, customize it.
          Everything display in status pages or in statistics pages can be modified, tuned and customized to your needs.

          To see how to customize it, use the command
              man rpimonitord
          and
              man rpimonitord.conf

          Man pages are also available in the wiki.

          You will find some examples of customisation in RPi-Monitor articles.


          Usage

          Once RPi-Monitor is configured as you wished, browse http://RPiIpAddress:8888/ to access to the web interface.

          Note: The graphs rendering may have strange behavior on Google-Chrome on Windows while it works fine on Linux. Internet Explorer is even not able to display statistics, it is then advised to use Firefox on Windows or better... switch to Linux! ;-). 

          RPi-Monitor: Version 2.4 is available

          $
          0
          0
          Note: A new version of RPi-Monitor is available: Version 2.5.
          All the details about the latest version of Rpi-Monitor are in RPi-Monitor overview

          The version 2.4 of RPi-Monitor has been released.

          If you don't know yet what RPI-Monitor do, have a look to RPi-Monitor Overview.

          Photo from Flickr  by Le Yéti AttributionNoncommercial cc-by-nc


          What's new in this version?

          Here is the changelog of version 2.4:
          • Change shared memory management to fix issue #12 and define the shmkey in configuration file
          • Added the possibility to define the default timeline to be display in statistics page
          • Add -s (show) option to show configuration as loaded (useful for advanced customization)
          • Added WiFi icon
          •  

          Installation

          Download it from the official repository in Github:
              sudo wget http://goo.gl/P4Bl6I -O rpimonitor_2.4-1_all.deb

          Install the dependencies by executing the following command (be careful, the file in red is a new dependency):
              sudo apt-get install librrds-perl libhttp-daemon-perl libjson-perl libipc-sharelite-perl

          Installation or upgrade can be done with the command:
              sudo dpkg -i rpimonitor_2.4-1_all.deb


          Customization

          RPi-Monitor is fully configurable so if the displayed information doesn't match you need, customize it.
          Everything display in status pages or in statistics pages can be modified, tuned and customized to your needs.

          To see how to customize it, use the command
              man rpimonitord
          and
              man rpimonitord.conf

          Man pages are also available in the wiki.

          You will find some examples of customization in RPi-Monitor articles.


          Usage

          Once RPi-Monitor is configured as you wished, browse http://RPiIpAddress:8888/ to access to the web interface.

          Note: The graphs rendering may have strange behavior on Google-Chrome on Windows while it works fine on Linux. Internet Explorer is even not able to display statistics, it is then advised to use Firefox on Windows or better... switch to Linux! ;-). 

          Add WiFi to Raspberry Pi and monitor it with RPi-Monitor

          $
          0
          0
          For internet connection, it could be interesting to add a WiFi connection to the Raspberry Pi.

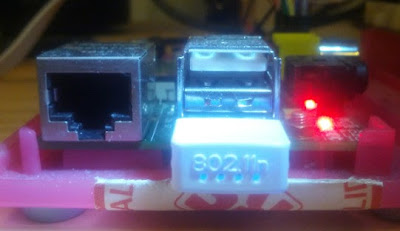
          Raspberry Pi with WiFi 802.11n dongle


          This article is explaining how to configure WiFi  n a Raspberry Pi and how to monitor this new network interface with RPi-Monitor.


          Installing the WiFi network

          I did purchase a dongle Ralink on the Internet for few euros.

          Once plugged, the dongle automatically appears in usb list:

          pi@raspberrypi~ $ lsusb
          Bus 001 Device 002: ID 0424:9512 Standard Microsystems Corp. 
          Bus 001 Device 001: ID 1d6b:0002 Linux Foundation 2.0 root hub
          Bus 001 Device 003: ID 0424:ec00 Standard Microsystems Corp. 
          Bus 001 Device 004: ID 148f:5370 Ralink Technology, Corp. RT5370 Wireless Adapter

          The new WIFI interface is also visible in network configuration:

          pi@raspberrypi~ $ ip link
          1: lo: <LOOPBACK,UP,LOWER_UP> mtu 16436 qdisc noqueue state UNKNOWN mode DEFAULT 
              link/loopback 00:00:00:00:00:00 brd 00:00:00:00:00:00
          2: eth0: <NO-CARRIER,BROADCAST,MULTICAST,UP> mtu 1500 qdisc pfifo_fast state DOWN mode DEFAULT qlen 1000
              link/ether b8:27:eb:xx:xx:xx brd ff:ff:ff:ff:ff:ff
          3: wlan0: <BROADCAST,MULTICAST,UP,LOWER_UP> mtu 1500 qdisc mq state UP mode DORMANT qlen 1000
              link/ether 7c:dd:90:xx:xx:xx brd ff:ff:ff:ff:ff:ff

          To see the network present and validate the WiFi connection, lets use the command iwlist

          pi@raspberrypi ~ $ sudo iwlist wlan0 scan

          You should see a lot of information about all the WiFi network present in your environment.

          The network can be configured manually with the command iwconfig but it is more interesting modify the network configuration file to have the WiFi connection configured automatically at startup.

          Here are the line to add to the configuration file /etc/network/interfaces:

          auto wlan0
          iface wlan0 inet static
              wpa-ssid XxXxXxXxX
              wpa-psk xXxXxXxXx
              wireless-power off
              address 192.168.0.123
              netmask 255.255.255.0
              network 192.168.0.0
              broadcast 192.168.0.255
              gateway 192.168.0.254

          You can see the static network configuration address, network,  netmask and gateway.

          The parameters  wpa-ssidwpa-psk and wireless-power are specific to the WiFi configuration:
          • wpa-ssid : The name of your network 
          • wpa-psk :  The password of the network 
          • wireless-power off : To turn off the power management which, for a server, could cause some network latency and connection loss.  
          Once the configuration is done, you can start your new network with the following command:

          pi@raspberrypi ~ $ sudo ifup wlan0

          And check the configuration:

          pi@raspberrypi ~ $ ip address
          1: lo: <LOOPBACK,UP,LOWER_UP> mtu 16436 qdisc noqueue state UNKNOWN 
              link/loopback 00:00:00:00:00:00 brd 00:00:00:00:00:00
              inet 127.0.0.1/8 scope host lo
          2: eth0: <NO-CARRIER,BROADCAST,MULTICAST,UP> mtu 1500 qdisc pfifo_fast state DOWN qlen 1000
              link/ether b8:27:eb:xx:xx:xx brd ff:ff:ff:ff:ff:ff
              inet 10.42.0.123/24 brd 10.42.0.255 scope global eth0
          3: wlan0: <BROADCAST,MULTICAST,UP,LOWER_UP> mtu 1500 qdisc mq state UP qlen 1000
              link/ether 7c:dd:90:xx:xx:xx brd ff:ff:ff:ff:ff:ff
              inet 192.168.0.123/24 brd 192.168.0.255 scope global wlan0

          Configuring RPi-Monitor to manage this new network interface

          Adding the new information and graph is done by the following configuration:
          Warning: Be sure to use Linux filefeed format with line ending with LF (and not CR/LF like in Windows).

          ########################################################################
          # Graph WLAN
          ########################################################################
          dynamic.
          17.name=wifi_received
          dynamic.
          17.source=/sys/class/net/wlan0/statistics/rx_bytes
          dynamic.
          17.regexp=(.*)
          dynamic.
          17.postprocess=$1*-1
          dynamic.
          17.rrd=DERIVE

          dynamic.
          18.name=wifi_send
          dynamic.
          18.source=/sys/class/net/wlan0/statistics/tx_bytes
          dynamic.
          18.regexp=(.*)
          dynamic.
          18.postprocess=
          dynamic.
          18.rrd=DERIVE

          web.status.1.content.
          9
          .name=WiFi
          web.status.1.content.
          9.icon=wifi.png
          web.status.1.content.
          9.line.1="WiFi Sent: <b>"+KMG(data.wifi_send)+"<i class='icon-arrow-up'></i></b> Received: <b>"+KMG(Math.abs(data.wifi_received)) + "<i class='icon-arrow-down'></i></b>"

          web.statistics.1.content.
          9.name=WiFi
          web.statistics.1.content.
          9.graph.1=wifi_send
          web.statistics.1.content.
          9.graph.2=wifi_received
          web.statistics.1.content.
          9.ds_graph_options.net_send.label=Upload bandwidth (bits)
          web.statistics.1.content.
          9.ds_graph_options.net_send.lines={ fill: true }
          web.statistics.1.content.
          9.ds_graph_options.net_send.color="#FF7777"
          web.statistics.1.content.
          9.ds_graph_options.net_received.label=Download bandwidth (bits)
          web.statistics.1.content.
          9.ds_graph_options.net_received.lines={ fill: true }
          web.statistics.1.content.
          9.ds_graph_options.net_received.color="#77FF77"

          This configuration is basically a copy of eth0 configuration. the value in blue have been updated:
          • The name of the data extracted have been changed as well as the interface to monitor
          • Status row has been updated to use the WiFi icon and to display WiFi as title
          • The graph are configured to use the newly extracted values
          • Finally, the indexes have been updated to follow the existing ones


            RPi-Monitor: Version 2.5.1 is available

            $
            0
            0
            Note: A new version of RPi-Monitor is available: Version 2.6.
            All the details about the latest version of Rpi-Monitor are in RPi-Monitor overview

            The version 2.5.1 of RPi-Monitor has been released (replacing the version 2.5 due to issue #22).

            If you don't know yet what RPI-Monitor do, have a look to RPi-Monitor Overview.

            Photo from Flickr by todbot AttributionNoncommercial cc-by-nc 

            What's new in this version?
            Some users have pushed their Raspberry Pi to its limits and found some side effect in RPi-Monitor. This version comes with improvement to fix such side effects. Thanks to allo the contributoirs which help me to improve RPi-Monitor.

            Here is the changelog of version 2.5.1:

            • Update rrd graph with unkown data if fetched information is not a valid number
            • Fix issue #22 : empty.rrd file not properly generated

            And changelog of version 2.5:
            • Fix issue #16: (v2.4) Network Graph displaying Bytes/s not in bits/s (wrong Legend) (From deMattin)
            • Update configuration to be compatible with NOOBS as proposed in issue #17 (From deMattin)
            • Implement modification for small screen proposed in issue #18 (From deMattin)
            • Change footer to better fit with small screens
            • Implement pull request #20: Counting buffers and cache as available memory (From Harbulot)
            • Add the possibility to set Min and Max values for rrd graphs in configuration file (issue #19 #21)


            Installation

            Download it from the official repository in Github:
                sudo wget http://goo.gl/yv46v3 -O rpimonitor_2.5.1-1_all.deb

            Install the dependencies by executing the following command (be careful, the file in red is a new dependency):
                sudo apt-get install librrds-perl libhttp-daemon-perl libjson-perl libipc-sharelite-perl

            Installation or upgrade can be done with the command:
                sudo dpkg -i rpimonitor_2.5.1-1_all.deb


            Upgrade

            If you are doing an upgrade and want to remove the strange peak you may see in network graphs, you should adjust the min and max values of RRD database storing network information.
            This can be done with the two following commands:

            rrdtool tune /usr/share/rpimonitor/web/stat/net_received.rrd -a net_received:0 
            rrdtool tune /usr/share/rpimonitor/web/stat/net_send.rrd -i net_send:0

            Customization

            RPi-Monitor is fully configurable so if the displayed information doesn't match you need, customize it.
            Everything display in status pages or in statistics pages can be modified, tuned and customized to your needs.

            To see how to customize it, use the command
                man rpimonitord
            and
                man rpimonitord.conf

            Man pages are also available in the wiki.

            You will find some examples of customization in RPi-Monitor articles.


            Usage

            Once RPi-Monitor is configured as you wished, browse http://RPiIpAddress:8888/ to access to the web interface.

            Note: The graphs rendering may have strange behavior on Google-Chrome on Windows while it works fine on Linux. Internet Explorer is even not able to display statistics, it is then advised to use Firefox on Windows or better... switch to Linux! ;-). 

            RPi-Monitor: Version 2.6 is available

            $
            0
            0
            Note: A new version of RPi-Monitor is available: Version 2.7.
            All the details about the latest version of Rpi-Monitor are in RPi-Monitor overview


            The version 2.6 of RPi-Monitor has been released.

            If you don't know yet what RPI-Monitor do, have a look to RPi-Monitor Overview.


            What's new in this version?
            This version is coming with few improvement and bug fixes.

            Here is the changelog of version 2.6:
            • Add version.json, menu.json and friends.json generation to fix issue #25
            • Check is file is executable (instead of existing) to define if it should be executed
              Warning: a new perl dependency has been added: File::Which
            • Generate empty.rrd at each request to fix issue #23
            • Generate empty.rrd at each start workaround for issue #23 when using an external web server
              Note: empty.rrd need to be generated each time a static data need to be drawn into a graph. The embedded server does that. With external server, it is not possible. Restarting RPI-Monitor periodically will improve the accuracy but not fix the bug.
            • Improve shellinabox management <IP>/shellinabox forwards to https://<IP>:4200
            • Add RPi-Monitor Interactive Configuration Helper

            Installation

            Download it from the official repository in Github with the command:
                wget http://goo.gl/WdK354 -O rpimonitor_2.6-1_all.deb

            If you have issue with GnuTLS: A TLS warning alert coming from Github you can download it with the following command:
                curl -L http://goo.gl/WdK354 -o rpimonitor_2.6-1_all.deb

            Install the dependencies by executing the following command (use command apt-get if aptitude is not available on your target system):
                sudo aptitude install librrds-perl libhttp-daemon-perl libjson-perl libipc-sharelite-perl libfile-which-perl

            Installation or upgrade can be done with the command:
                sudo dpkg -i rpimonitor_2.6-1_all.deb

            Complete the installation with the command:
                sudo apt-get update && sudo service rpimonitor update

            Upgrade

            If you are doing an upgrade you should add the new perl dependency before installing RPi-Monitor package:
                sudo aptitude install libfile-which-perl

            RPi-Monitor interactive configuration helper

            This version of RPi-Monitor introduce a new feature named "Interactive Configuration Helper". This new feature is accessible with the commend:
                rpimonitord -i

            The interactive configuration helper will ask you to enter information and will help you to define the correct configuration. I'll will write a post dedicated to this feature, until now, you can just give a try and follow the instructions... Your comments are welcome to improve this new feature.

            About shellinabox

            Shellinabox allow you to access to the shell of your Raspberry Pi through a web interface. You can activate this feature into the configuration dialog box.
            By default, the link is set to '''/shellinabox'''. When RPi-Monitor will reciee this request, it will automatically do a redirect to http://RPiIpAddress:4200/. You can modify this address to point to your shellinabox address. This address is used inside the iframe of shellinabox page.

            Customization

            RPi-Monitor is fully configurable so if the displayed information doesn't match you need, customize it.
            Everything display in status pages or in statistics pages can be modified, tuned and customized to your needs.

            To see how to customize it, use the command
                man rpimonitord
            and
                man rpimonitord.conf

            Man pages are also available in the wiki.

            To define the configuration you can use RPi-Monitor Interactive Configuration Helper whit the command:
                rpimonitord -i

            You will find some examples of customization in RPi-Monitor articles.


            Usage

            Once RPi-Monitor is configured as you wished, browse http://RPiIpAddress:8888/ to access to the web interface.

            Note: The graphs rendering may have strange behavior on Google-Chrome on Windows while it works fine on Linux. Internet Explorer is even not able to display statistics, it is then advised to use Firefox on Windows or better... switch to Linux! ;-). 

            RPi-Monitor Interactive Configuration Helper

            $
            0
            0
            Version 2.6 introduced a new feature named RPi-Monitor Interactive Configuration Helper. This article is detailling how to use it to monitor a ntfs volume.

            First execute the following command:

            rpimonitord -i


            Press Enter


            Enter : df -t ntfs


            RPi-Monitor will tell you how it will process the source.
            In our example, it will execute the command df.
            If it is correct, press Enter, if not, enter no ( or No or n or ) to go back to previous screen.


            RPi-Monitor show you the ouput of the command as defined as source. If the output is the one expected press Enter, if not, RPi-Monitor will ask you to define the source again.


            By default the regulare expression is (.*). This will return all the data given by the source.
            In the following screen you will see how we will find the regular expression extracting the available space of our ntfs drive step by step.

            Step one, hit Enter to see what is given by the source by default.


            The output is not the one expected hit Enter to define a new Regular expression.
            The data is located after sda1. Lets enter the following regular expression: sda1(.*) to get what is after sda1.


            The output is not the one expected yet hit Enter to define a new Regular expression.
            The data is located after sda1 after some spaces \s+, some numbers \d+, some spaces \s+, some numbers \d+, some spaces \s+ and is composed of numbers (\d+).
            Enter then the following regulare expression: sda1\s+\d+\s+\d+\s+(\d+)


            The result is now the one expected , enter Yes ( or yes or Y or y )


            We want the value in MB while is it given in kB. We then need to devide it by 1024.
            The formula is then: $1/1024


            This is the expected value, enter yes


            The value extracted is variable so dynamic so enter No.


            RPi-Monitor gives you the template of configuration. You now have to copy it into an existing configuration file or  add anew file into /etc/rpimonitord.conf.d/ and update the text inside <>.

            dynamic.20.name=storage2_available
            dynamic.20.source=df -t ntfs
            dynamic.20.regexp=sda1\s+\d+\s+\d+\s+(\d+)
            dynamic.20.postprocess=$1/1024
            dynamic.20.rrd=GAUGE

            Once the configuration will be apply, restart RPi-Monitor with the command:

            /etc/init.d/rpimonitor restart

            I hope this post is detailled enough to help you to configure RPi-Monitor to define the correct sources and regular expression.

            RPi-Monitor join the PiStore

            $
            0
            0
            RPi-Monitor is joining The Pi Store
            The version 2.6 is the 14th release of RPi-Monitor and the first to be available in the store.
            Next versions will also be installable from the store...


            The dedicated page is available here : http://store.raspberrypi.com/projects/rpi-montor.
            RPi-Monitor will continue to be installable using the standard process using the .deb package which have the advantage to not be dependent of any Graphical User Interface.


            Here are the instructions (directly extracted from PiStore web site) explaining how to use the PiStore:

            Download Client

            To download and use apps from the Pi Store you will require the Pi Store application.

            If you're using the official operating system image, the Pi Store will already be installed on your Raspberry Pi, but if you need to reinstall it you can download it from the official repository.

            Open a terminal window and type:

            sudo apt-get update && sudo apt-get install pistore


            Why do you need the Pi Store application?

            Silent installs: Enable this feature and you don't have to worry about clicking through an installer! Download the app and next thing you know you'll have a notification saying it's ready to go.

            Product updates: Get automatic updates to the items in your library as soon as they're released.


            RPi-Monitor: Version 2.7 is available

            $
            0
            0

            Note: A new version of RPi-Monitor is available: Version 2.8.
            All the details about the latest version of Rpi-Monitor are in RPi-Monitor overview

            The version 2.7 of RPi-Monitor has been released.

            If you don't know yet what RPI-Monitor do, have a look to RPi-Monitor Overview.

            Photo from Flickr AttributionShare Alike cc-by-sa by Adrienne Yancey


            What's new in this version?
            This version is coming with internal changes, improvement and bug fixes.

            Here is the changelog of version 2.7:
            • Change directory storing configuration to /etc/rpimonitor/
            • Change configuration file name to better names
            • Create a template directory for configuration files
            • Change location of RRD storage to /var/lib/rpimonitor
            • Add xbian support and distribution automatic detection in debian package
            • Cleanup shellinabox menu display and configuration
            • Change ownership of empty.rrd to activate on demand regeneration Fixing issue #23
            • Update raspbian.conf to make it compatible with NOOBS installation
            • Update jquery (v2.1.1) and bootstrap (v2.3.2)
            • Update disk usage formula for better compatibility
            • Add 'Label' function for status page


            Installation

            Download it from the official repository in Github with the command:
                wget http://goo.gl/Alzgej -O rpimonitor_2.7-1_all.deb

            If you have issue with GnuTLS: A TLS warning alert coming from Github you can download it with the following command:
                curl -L http://goo.gl/Alzgej -o rpimonitor_2.7-1_all.deb

            Install the dependencies by executing the following command (use command apt-get if aptitude is not available on your target system):
                sudo aptitude install librrds-perl libhttp-daemon-perl libjson-perl libipc-sharelite-perl libfile-which-perl

            Installation or upgrade can be done with the command:
                sudo dpkg -i rpimonitor_2.7-1_all.deb

            Complete the installation with the command:
                sudo apt-get update && sudo service rpimonitor update

            Upgrade

            This version of RPi-Monitor introduce some changes in the internal file organisation. This new organisation is described in detail into PACKAGING.md.
            RPi-Monitor package is designed to automatically make the migration from previous version.
            To avoid any loss, it is still recommended to backup the directories /usr/share/rpimonitor/web/stat/, /etc/rpimonitord.conf and /etc/rpimonitord.conf.d/*. In case of issue, refer to PACKAGING.md to see where files should be restaured and how.

            Label function to reflect status

            This version of RPi-Monitor introduce a new function dedicated to show the status of a service. This function is named "Label". I'll write a dedicated post to present this function. If you can't wait, you can have a look to the manpage and the to file template/services.conf which is showing how to use it.

            About shellinabox

            Shellinabox allow you to access to the shell of your Raspberry Pi through a web interface. You can activate this feature into the configuration dialog box.
            By default, the link is set to '''/shellinabox'''. When RPi-Monitor will recieve this request, it will automatically do a redirect to http://RPiIpAddress:4200/. You can modify this address to point to your shellinabox address. This address is used inside the iframe of shellinabox page.

            Customization

            RPi-Monitor is fully configurable so if the displayed information doesn't match you need, customize it.
            Everything display in status pages or in statistics pages can be modified, tuned and customized to your needs.

            To see how to customize it, use the command
                man rpimonitord
            and
                man rpimonitord.conf

            Man pages are also available in the wiki.

            To define the configuration you can use RPi-Monitor Interactive Configuration Helper whit the command:
                rpimonitord -i

            You will find some examples of customization in RPi-Monitor articles.


            Usage

            Once RPi-Monitor is configured as you wished, browse http://RPiIpAddress:8888/ to access to the web interface.

            Note: The graphs rendering may have strange behavior on Google-Chrome on Windows while it works fine on Linux. Internet Explorer is even not able to display statistics, it is then advised to use Firefox on Windows or better... switch to Linux! ;-).

            RPi-Monitor: Use labels to show servers status

            $
            0
            0
            RPi-Monitor version 2.7 introduces a new javascript function named Label.


            The goal of this function is to add a colored text reflecting the status of a service.

            This post is explaining how this new feature can be used.

            Note: In version 2.10, a closing parenthesis ' ) ' is missing in the last line of  service.conf .
            If you want to use this file as a source of your customisation, remember to add to fix this issue. It is already fixed in github repositories (and future releases).


            Label funtion overview

            The function Label is designed to write a text highligted by a color.
            Label(value, condition, text, level)
            This function determine if the label has to be displayed ot not base on a value (extracted by RPi-Monitor) and a condition. The label contains a text to be displayed and a level. 6 levels of labels are available with 6 differences colors:


            How to use it?

            The file /etc/rpimonitor/template/services.conf is showing an example of Label usage.

            In this example, we monitor if the service ssh is listening on port 22 and display a label _OK_ if yes or a lable _KO_ if not.
            We do the same for RPi-Monitor on port 8888 and for nginix on port 80 and 443.


            How does it work?

            Information is extracted from the command netstat.
            The regular expression will return the port number if a service is listening on this port or nothing if no service is listenning on this port.
            Note: these regular expression may be optimised to return more accurrate result.

            The results are accessible into javascript from the variable data. This variable is passed to the Label function as value.
            For ssh, the condition is "==22" to check if the value is equal to 22 or "!=22" to check if the value is different form 22. As only one of the condition will be true, only one label will be displayed.

            Other ports checking are using the same technic.


            Example of Label function used to show server status


            As you see, the usage of this new function is quite easy. You can now imagine how to use it for your own needs.


            RPi-Monitor: Version 2.8 is available

            $
            0
            0
            Note: A new version of RPi-Monitor is available: Version 2.9.
            All the details about the latest version of Rpi-Monitor are in RPi-Monitor overview


            The version 2.8 of RPi-Monitor has been released.

            If you don't know yet what RPI-Monitor do, have a look to RPi-Monitor Overview.

            Picture from Flickr cc-by by Duncan Hull

            What's new in this version?
            This version is coming with internal changes, improvement and bug fixes.

            Here is the changelog of version 2.8:
            • Add debian repository using github as repo
            • Manage configuration indexes unicity per file
            • Add 'include' parameter to load additionnal configuration file 
            • Split configuration files and use 'include' in default configuration file
            • Add parameters to customise menu logo, title and page title
            • Add 'Badge' function for status page (similar to Label)
            • Simplify and fix startup scripts
            • Change ownership of cron script to avoid issue with logs
            • Check if HTML5 localStorage is activated and warn user is not
            • Improve upgradable packages detection


            Installation of the repository and upgrade to 2.8

            One of the major improvement of this version is the activation of a debian repository directly into github. This repository will make installation and update of RPi-Monitor accessible with the commands apt-get or aptitude.

            To use this repository follow the instruction bellow:

            Activate https transport for apt and add certificate authority:
             

                sudo apt-get install apt-transport-https ca-certificates

            Execute the following command to add RPi-Monitor into your list of repository:
             

                sudo wget http://goo.gl/rsel0F -O /etc/apt/sources.list.d/rpimonitor.list

            To install RPi-Monitor, execute the following command: 

                sudo apt-get update
                sudo apt-get install rpimonitor

            To upgrade RPi-Monitor, execute the following command:


                sudo apt-get update
                sudo apt-get upgrade

            Note: The package is not signed, it will be require to accept installation of unauthenticated package.


            After installation you should excute the following command to update information about upgradable packages:

              sudo /usr/share/rpimonitor/scripts/updatePackagesStatus.pl

            Manual installation is still working. Refer to RPi-Monitor Installation page for explaination.

            Configuration indexes unicity simplification

            Doing customization of RPi-Monitor could become quite complex when you have many data to monitor and doing change, reorder on these configuration files could become a nightmare if you manage multiple files. The reason of this complixity was the unicity constraint of indexes over all configuration file.


            This version is removing this constraint. This requirement is now only applicable per file.

            This is meaning that when you need to add a new measurment point, you just have to create a new file and add the configuration lines as you would do for the first configuration file. You don't have to care about the existing indexes previously used.

            Removing this contrainst open the field of configuration possibilities. A new keyword have been added: include which can be used as follow:

                include=full_path/to/configuration_file.conf

            When RPi-Monitor will detect the include keyword, it will add the file to the list of configuration files to be loaded. In other words, the configuration files to load will be appended to the list of file to be loaded wherever is located of include keywork into a file.
            If you want to keep the control of the order of information display, it will then be recommanded to create one file per information and the create a file containing a list of configuration file to load. data.conf is now looking like that:


                [...]
              include=/etc/rpimonitor/template/version.conf
                include=/etc/rpimonitor/template/uptime.conf
                include=/etc/rpimonitor/template/cpu.conf
              [...] 

            Customise menu logo, title and page title

            This new function allow to define a custom logo, custome title and add the hostname of the machine int the title of the browser.


            Here are the configuration lines used by default:

              web.page.icon='img/avatar.png'
              web.page.menutitle='XB-Monitor  <sub>('+data.hostname+')</sub>'
              web.page.pagetitle='XB-Monitor ('+data.hostname+')'


            data.hostname is a value automatically extracted by RPi-Monitor. It is not needed to add a configuration to do such a thing.

            The file avatar.png has been added into /usr/share/rpimonitor/web/img/.

            Here is the result:


            Inside Firefox title bar and tab, the title has been changed and hostmane has been added between parentheses.
            Inside RPi-Monitor menu bar, le logo and the title have been changed and hostmane has been added between parentheses.


            Badges function to reflect status

            This version of RPi-Monitor introduce a new function dedicated to show the status of a service. This function is named "Badge". This function is very similar to the function "Label" introduced in version 2.7. To use this function,you can refer to the article Rpi-Monitor: Use Label to show server status and replace Label by Badge.


            About shellinabox

            Shellinabox allow you to access to the shell of your Raspberry Pi through a web interface. You can activate this feature into the configuration dialog box.

            By default, the link is set to '''/shellinabox'''. When RPi-Monitor will recieve this request, it will automatically do a redirect to http://RPiIpAddress:4200/. You can modify this address to point to your shellinabox address. This address is used inside the iframe of shellinabox page.

            Customization

            RPi-Monitor is fully configurable so if the displayed information doesn't match you need, customize it.
            Everything display in status pages or in statistics pages can be modified, tuned and customized to your needs.

            To see how to customize it, use the command
                man rpimonitord
            and
                man rpimonitord.conf

            Man pages are also available in the wiki.

            To define the configuration you can use RPi-Monitor Interactive Configuration Helper whit the command:
                rpimonitord -i

            You will find some examples of customization in RPi-Monitor articles.


            Usage

            Once RPi-Monitor is configured as you wished, browse http://RPiIpAddress:8888/ to access to the web interface.

            Note: The graphs rendering may have strange behavior on Google-Chrome on Windows while it works fine on Linux. Internet Explorer is even not able to display statistics, it is then advised to use Firefox on Windows or better... switch to Linux! ;-).
            Viewing all 30 articles
            Browse latest View live